How to balance coverage, precision and clarity?
Choosing a descriptive set of examples is one of the biggest challenges for good specifications. There are many ways to demonstrate any particular scenario, and finding the right balance between precision, coverage and clarity is sometimes difficult. For the next Given-When-Then With Style challenge, we’ll look into guidelines on choosing the right set of examples.
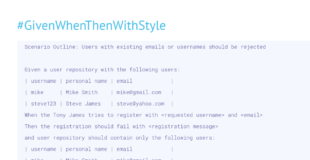
To make this more concrete, consider a volume discount rule that provides 10% off for purchases between 5 and 10 items, 15% for purchases between 10 and 20; and 20% above that. We can show this with the following scenario outline structure:
Given the purchase order contains <items>
When the user checks out
Then the discount offered should be <discount>Here is the challenge
Here are several ways how we could capture the examples:
Option 1: Show ranges
|items            | discount |
|less than 5      |  0%      |
|between 5 and 10 | 10%      |
|between 10 and 20| 15%      |
|more than 20     | 20%      |
Option 2: Use single example from each group
|items            | discount |
|3                | 10%      |
|15               | 15%      |
|100              | 20%      |
Option 3: Show only interval edges
|items            | discount |
|1                |  0%      |
|5                |  0%      |
|6                | 10%      |
|9                | 10%      |
|10               | 15%      |
|19               | 15%      |
|20               | 20%      |
|21               | 20%      |
Option 4: Show all the values
|items            | discount |
|1                |  0%      |
|2                |  0%      |
|3                |  0%      |
...
|20               | 20%      |
|21               | 20%      |
Solving: "How to balance coverage, precision and clarity?"
Last time, you voted for different ways of trading off completeness and clarity in examples. This article shows the results of the survey, an analysis of the votes, and some general ideas on how to solve similar problems.
The winner is…

From the survey, two options got almost the same number of votes: showing the individual boundaries, and showing the ranges.
Regarding the “other” category, Ken Pugh posted a detailed response with several variants, showing how the solution could be captured as a scenario outline or a step table. He also proposed explaining the rule itself in more detail, as a comment in the feature file. Philip Wong wrote an interesting post suggesting using the Rule keyword to split the cases into several categories. The two responses could be even nicely combined, using the Rule keyword instead of a comment. (Although it makes no difference for test execution, using the Rule keyword would ensure that the related scenarios are grouped together in the results).
Focusing on the two popular options, the main reasons listed for showing ranges were that the scenarios were shorter compared to listing individual boundaries, and that the examples are closer to how the business rule was presented in the challenge. The main reasons listed for choosing the boundaries over ranges were explicitly showing important test values and that there was less ambiguity.
Lada Flac had a great comment on this problem:
Ranges show the business rules at first sight, which is most important as the main purpose of BDD is collaboration with the customer. The examples we should see what are the boundaries of each range. […] Single values from each group and interval edges are less business rules and more test cases.
Listing ranges is shorter than the alternatives and seems to provide the same level of completeness. However, it actually makes it easy to make wrong assumptions and subtle mistakes. To show that, I’ve made the original post intentionally inconsistent, but only two people picked up on that. With the original rule stating “15% for purchases between 10 and 20; and 20% above that”, should 20 be included in the first or the second group? There are valid justifications for both alternatives, and the examples for the options were (intentionally) different in how this was handled.
One participant proposed showing ranges, but using the mathematical interval syntax to specify if the edge values should be included or excluded in a particular interval. I doubt this will make it clearer for most stakeholders.
Chat, Choose, Check
Lada is right about the main purpose of BDD being collaboration between roles, but this collaboration needs to extend beyond just the discussion on user needs. Examples help us facilitate the cycle of collaborative analysis, refinement and testing. Ranges are great as a conversation starter, but they aren’t the best to ensure that everyone is on the same page.
I usually start collaborative analysis sessions by listing out the easy examples to demonstrate the rules, but then quickly push people towards identifying important boundaries. Showing the examples with 19, 20 and 21 items and explicitly talking about them will help us ensure that everyone is on the same page, and that developers and testers know exactly what to do. In this case, we’re dealing with numerical intervals, so boundaries are easy to identify. However, think about this in a more general sense. Edge cases are situations when the meaning of a concept changes, or when the usage starts to differs. Those are the areas where different people make different assumptions, and where misunderstanding is most likely to happen. If a corner of your domain is in the shadow, shine light on it by exposing the boundary and talking about it.
When it comes to capturing the Given-When-Then scenarios as a result of those conversations, it’s easy to throw away the boundaries and try to summarise the results. However, resist the urge to do that. Similarly to how boundaries help with the discussion, they will also help people who read your scenarios later. This doesn’t mean that you need to keep all the discussed boundaries for the conclusions. As a trivial example, if 21 and 20 turn out to be the same case, we can throw away the 21 case. But it’s still important to keep the boundaries to clearly show transitions.
Think about the role of examples in BDD as Chat-Choose-Check. We need the right examples to facilitate the discussion, then select some of them for acceptance criteria, and then create concrete test cases that will help drive development. Choosing the right set of examples is critical for being able to check them unambiguously later. And for this purpose, boundaries are usually the best option. But they can be difficult to understand without context. As Lada says, they are “less business rules and more test cases”. If we want to engage business users later to discuss scenarios, we need something more.
Balancing clarity and testing
So how do we get the best of both options? Several participants proposed showing the important boundaries but also listing the category (or range in this case) as a note. One option would be to add this note as an additional table column. This strikes a great balance between clarity of purpose, avoiding ambiguity and covering all the important cases. Here is the scenario from Ken Pugh’s post (the others are very similar):
Scenario Outline: Compute discount based on number of items

 Given the purchase order contains <items>
 When the user checks out
 Then the discount offered should be <discount>

Examples:
|items | discount | notes                   |
|1     |  0%      | less than 6             |
|5     |  0%      |                         |
|6     | 10%      | 6 to 9                  |
|9     | 10%      |                         |
|10    | 15%      | 10 to 19                |
|19    | 15%      |                         |
|20    | 20%      | 20 +                    |
|1000  | 20%      | Maximum number of items |
I quite like this solution, and it’s a lovely example of the technique to introduce an additional comment column into examples. For some more information on this technique, check out the answer to How to set up something that’s not supposed to exist?.